Overview
In this section, we'll cover:
- how to leverage metrics generated by subgraphs and the GraphOS router to understand who consumes our supergraph
Prerequisites
- Our supergraph running in the cloud
- Our main variant selected (the one that ends with
@current) in the list of Graphs in Studio
Observability and metrics
GraphOS management plane provides client-to-subgraph observability on a GraphQL operation. Let's explore how we can tap into some of those capabilities.
If you've done the front-end portion, you should have a little data within your organization. Let's take a look at what's available.
Clients view
In GraphOS Studio, click on Clients on the left-hand menu. If you've navigated a few pages on your front-end client, you should see some requests appear here under the same name that we've configured in Apollo Client called web-workshop-client.
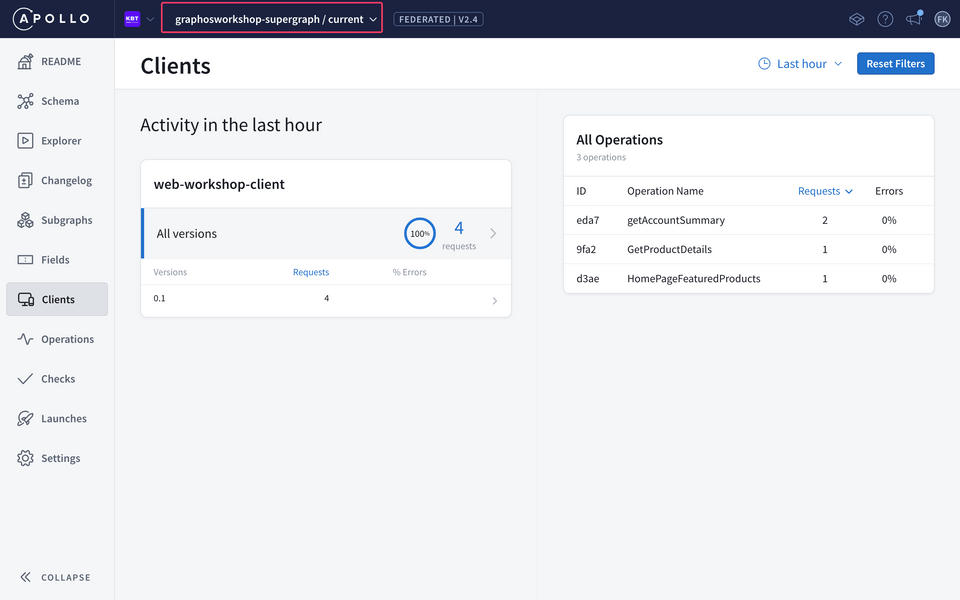
The client's panel gives us a concise view of how the graph is being used on a per client per version basis. This is captured when we have two headers apollographql-client-version and apollographql-client-name.
We can dig further by clicking on a specific version if we had more than one. In the right panel we see all the operations being called by this client within the time range (currently set to Last hour). If we click on an operation, this will take us to an operation view, which provides even more details.
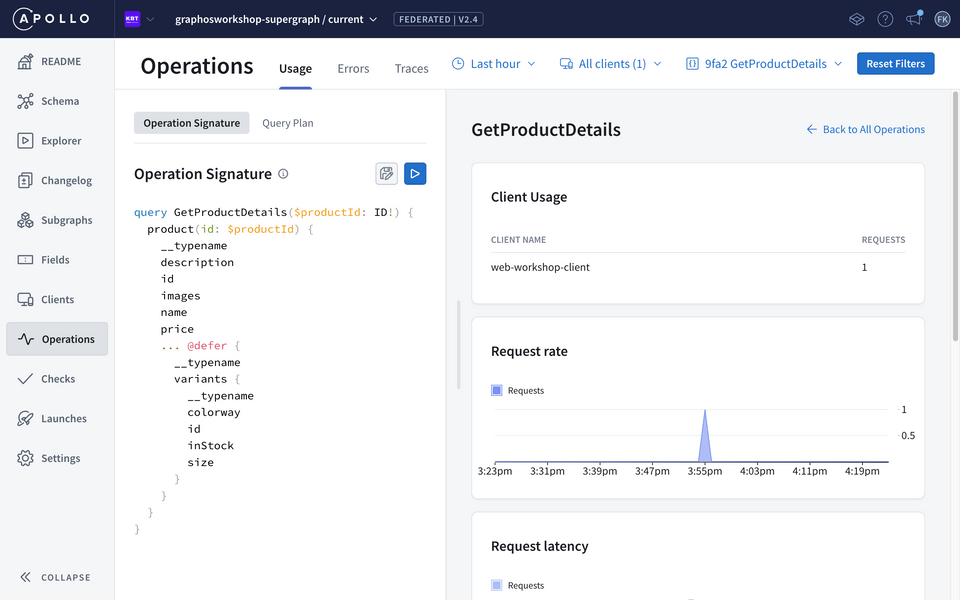
In summary, the client panel gives you a high-level view of how clients are consuming the graph as well as the type of operations being performed by a client and errors. This can be a great way to understand how to evolve a graph based on the needs and demand of the client.
Operations view
Let's take it one step further by seeing how we can dig into a graph operation and understand the performance associated with it.
- Go to Explorer, and paste the query below:
query getObservabilityTest($userId: ID!) {user(id: $userId) {firstNamelastNameaddressactiveCart {items {idcolorwaysizepriceparent {idnameimages}}subtotal}orders {iditems {idsizecolorwaypriceparent {idnameimages}}}}}
- On the bottom Variables panel, configure the variables with the following JSON payload:
{"userId": "10"}
- Important: And now set the Headers to simulate a mock client called
workshop-observability-testand set the version to1, as follows:
| Header | Value |
|---|---|
| apollographql-client-name | workshop-observability-test |
| apollographql-client-version | 1 |
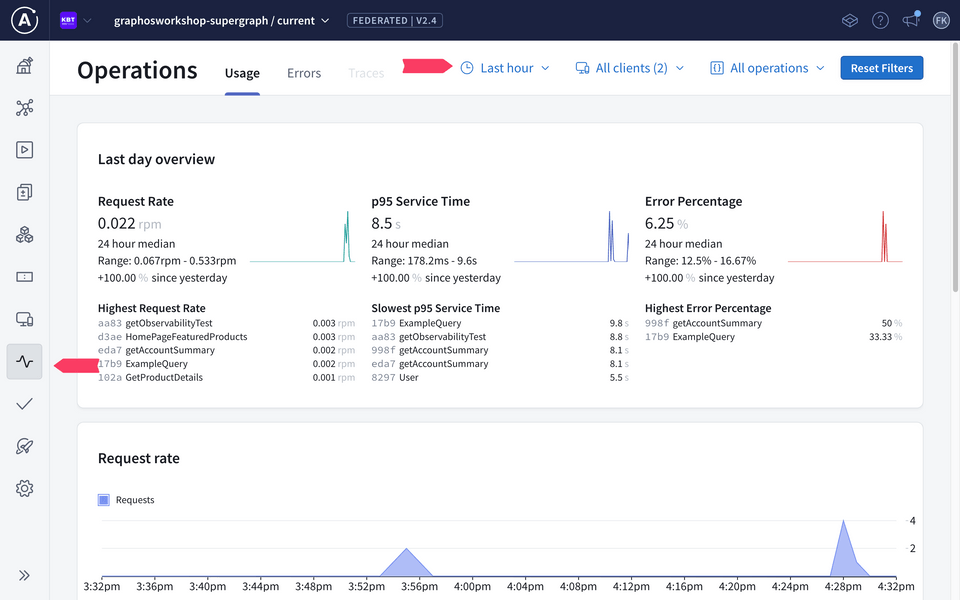
- Execute the query using the Run button. Wait a minute and go to the Operations view on the left hand side.
Operation details
The Operations view gives you important information around your supergraph such as: errors, slow p95, and high request operations.
In addition, it provides resolver-level tracing that helps us identify opportunities to improve your supergraph's overall performance by optimizing whichever resolvers currently act as a bottleneck.
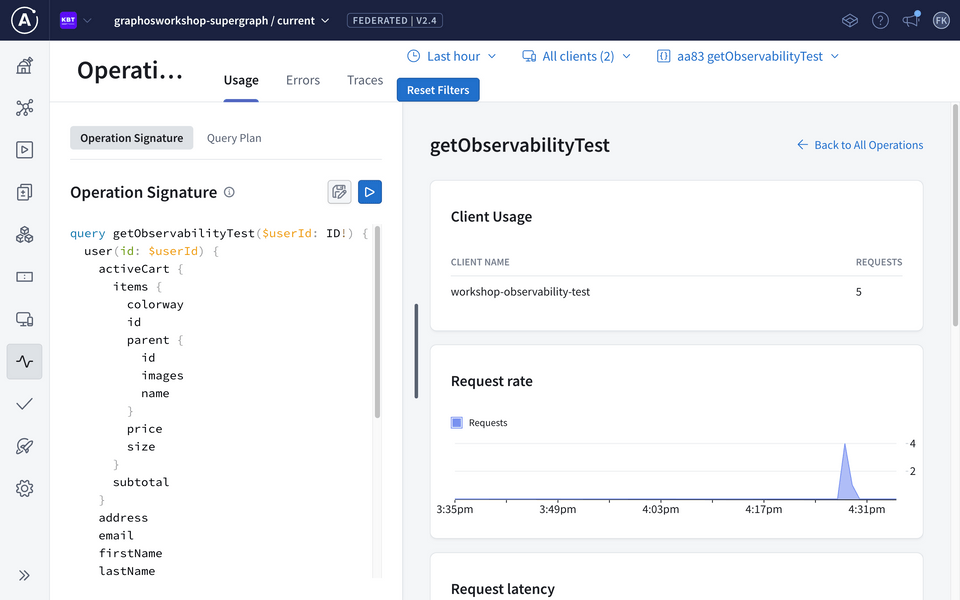
Let's see this in action and search for our recent operation, getObservabilityTest. Go to the top-right side of the panel and click on All Operations,; here we can search by field or operation names. Choose getObservabilityTest from the list to dive deeper into the details of the operation.
This provides a summary of the operation such as usage across clients, how often it's being requested, to the signature and errors associated with it.
Tracing
Let's see which subgraphs are making this request slow. At the top of the page, next to the Operations title click on Traces tab. Here we will get a sample trace of this operation with the request latency distribution, when it was sampled, caching policies associated with it, and the execution chain.
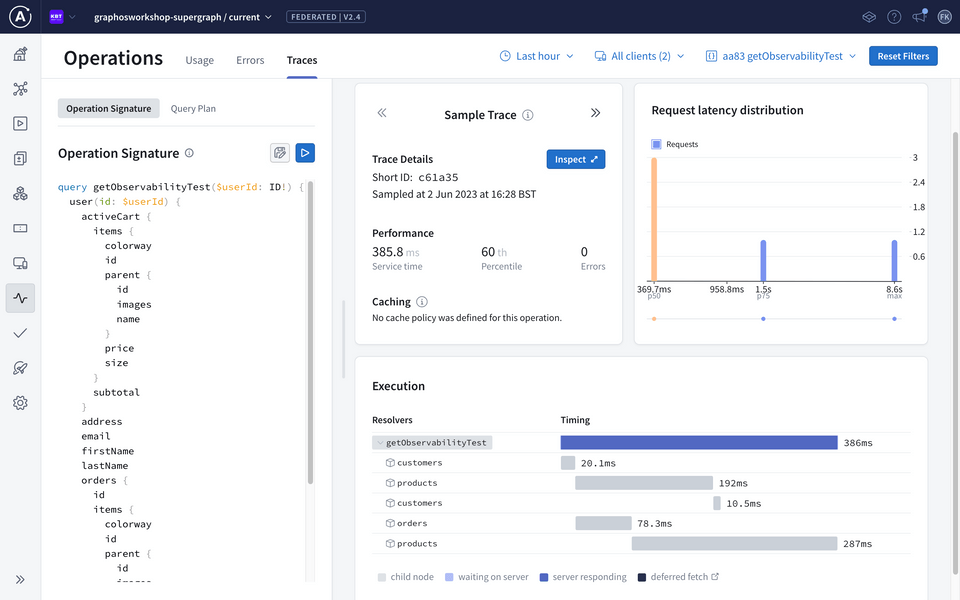
In our case, we can see that the product's subgraph causes the bulk of the slow response time, in our case it's likely due to resource constraint on our database container.
However, we could consider wrapping a @defer directive on the client side for these product calls, adding caching in front of our product subgraph, or looking into additional optimizations on the resolver through a data loader.
Currently out of scope for this workshop, but we can even configure subgraphs to provide field-level resolver statistics to pinpoint exactly where code-level optimizations are needed.
This allows the execution to be broken down per resolver level to determine latency contributions on a field. Your Apollo Solutions Engineer can demo this to learn more! https://www.apollographql.com/docs/graphos/metrics/usage-reporting/
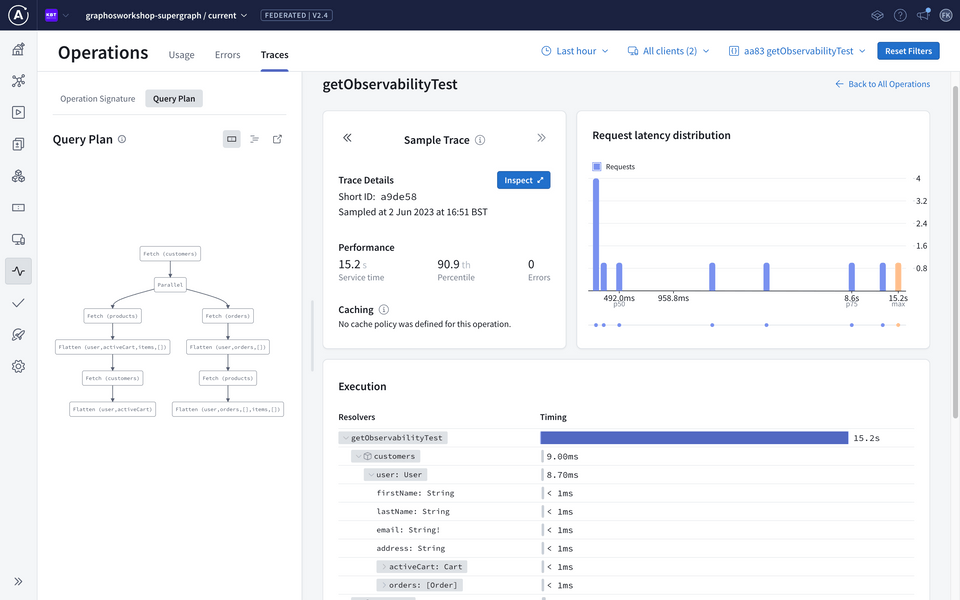
With this data stored in the GraphOS management plane, we can now perform client regression tests against schema changes with Schema Checks.
✏️ Schema checks
Important: make sure you've run through the Operation view exercise in the Observability portion, as this will be important for this quick exercise.
One of the most difficult parts of API development is understanding the impact of changes on downstream clients; API developers want assurance that their deployed changes won't break existing client traffic.
Schema checks provide API developers the confidence in delivering their changes by checking:
- Compatibility across other subgraphs (type collisions, composition integrity, etc)
- Clients regression based on graph consumption
- Checks down to underlying contracts
And lastly, this can be easily tied to any CI/CD pipeline.
Let's see this in action.
- Open the
Ordersschema from./rest-orders/schema.graphqlfile that we completed earlier. Your final schema should look like this:
Let's make a simple (breaking) change to order by renaming items to products, as follows:
"""A list of all the items they purchased. This is the Variants, not the Products so we know exactly which product and which size/color/feature was bought"""- items: [ProductVariant!]!+ products: [ProductVariant!]!}
Instead of publishing, let's run a check to see if this is a safe change by using the Rover CLI:
rover subgraph check --name orders <GRAPH_REF> --schema ./rest-orders/schema.graphql
Note: Make sure you change the GRAPH_REF in the command above.
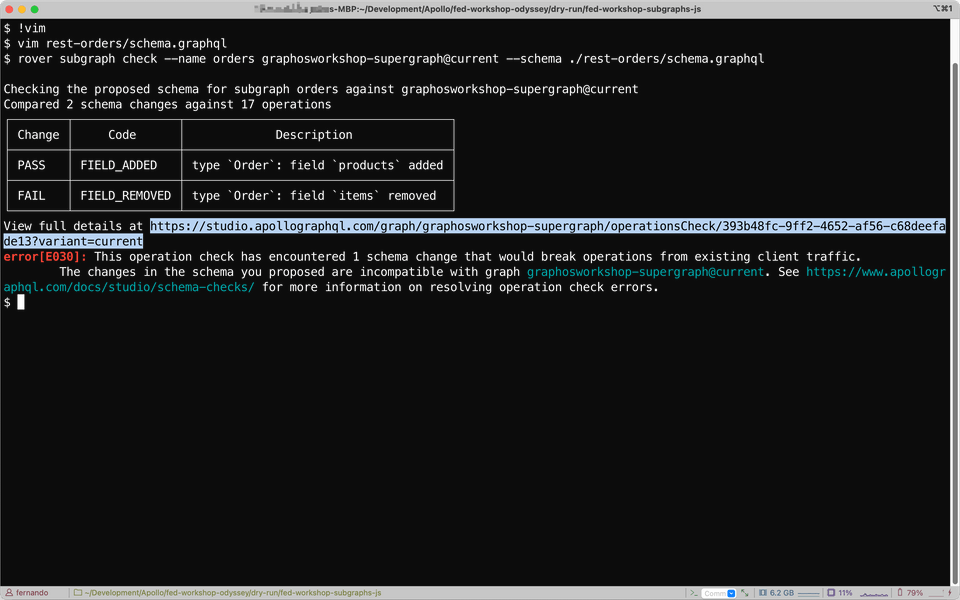
We can see within our CLI that the check results in an error, explaining that it would break an operation from an existing client, we can get more information in GraphOS Studio.
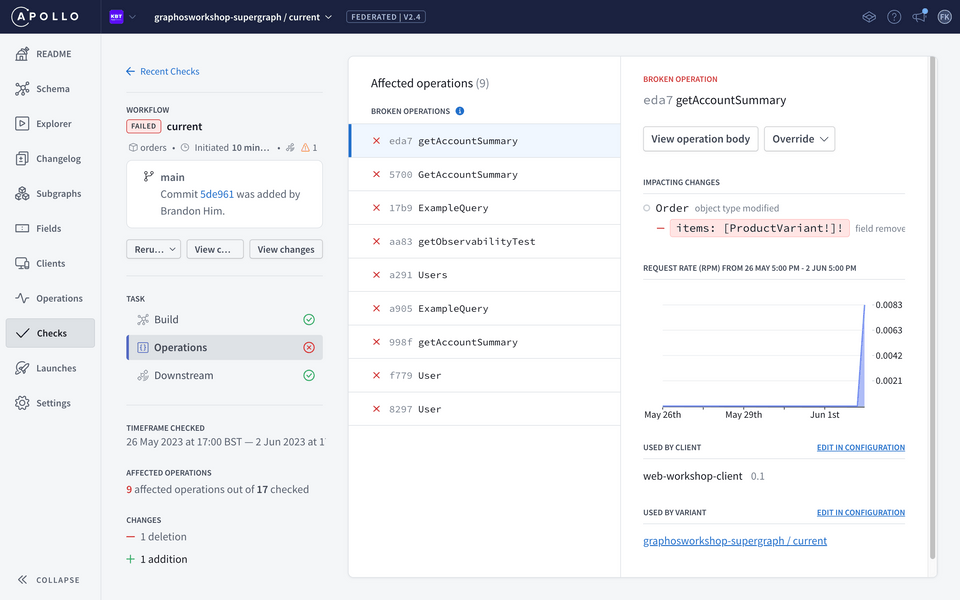
Let's take a look at the error in GraphOS Studio. In the left-hand side panel, open the Checks view and click on the most recent check that we ran on orders schema. Then, select the Operations task:
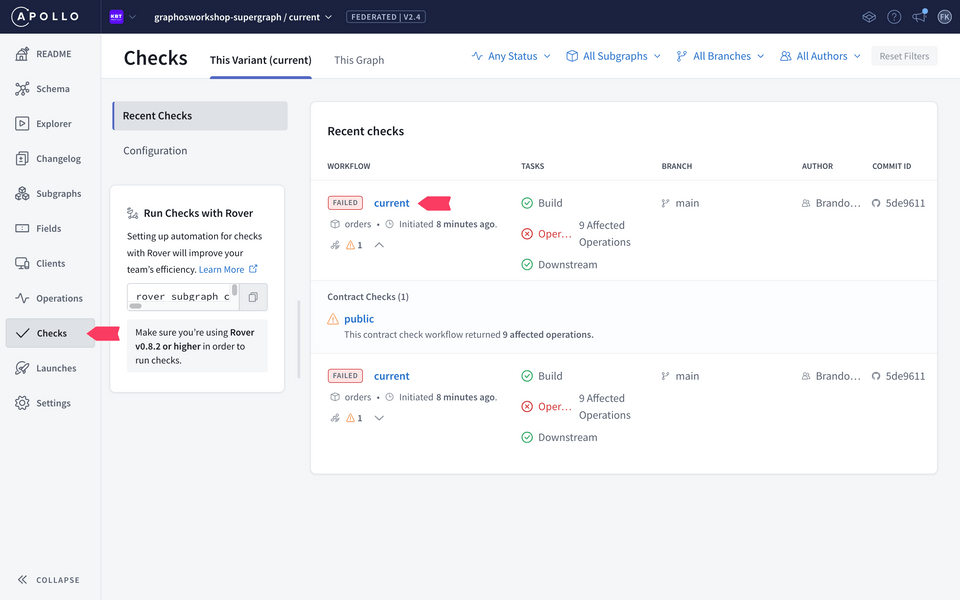
On the right panel, we can see the affected operations and a list of all the clients. While your list may be slightly different, we should see the mock client we specified in the observability section as a client that would be impacted by this change. We can additionally configure particular clients to exclude in our checks as well.
In a real world scenario we may have a long list of different clients, showcasing their dependency on particular fields and operations. Checks provide confidence that changes can be done safely or if there are additional considerations before committing that schema change, all without communicating across different teams.
Conclusion
🎉 Congratulations on completing this lab! 🎉
To recap, we've learned how to build a supergraph composed of three subgraphs using Apollo Federation.
A supergraph is a single GraphQL schema that combines multiple subgraphs into a unified data graph. We saw how each subgraph can be developed and deployed independently. Lastly, we also explored how to use GraphOS to manage our supergraph, monitor its performance, and safely ensure changes and contributions across individual subgraph teams.
GraphOS Router is the execution fabric for the supergraph - a powerful runtime that connects backend and front-end systems in a modular way. GraphOS also has an integrated management plane to help developers manage, evolve, and collaborate on the supergraph. GraphOS lets you connect all your data and services seamlessly with federation.
We hope you enjoyed this lab and gained some valuable skills and insights into GraphQL development. If you have any questions or feedback, please feel free to contact us.
Thank you for your participation!