Overview
The Airlock team has successfully implemented its newest feature (Project Galactic Coordinates), which has evolved and expanded the capabilities of the Airlock graph. They've also made sure to maintain the graph by adding new arguments and removing unused fields. Let's explore how we can continue to keep track of the graph's health and performance.
In this lesson, we will:
- Explore supergraph insights through the operation and field metrics provided by GraphOS
- Learn how to interpret metrics for field executions and referencing operations
Metrics in GraphOS
GraphOS provides us with observability tools to track the health and performance of our graph. These tools help surface patterns in how our graph gets used, which helps us identify ways to continue improving our graph.
We can find these metrics under the Insights page in Studio.
Operation metrics
The Operations tab is selected by default in the Insights page. It gives us an overview of operation request rates, service time, and error percentages, including specific operations for each of these that might be worth drilling deeper into.
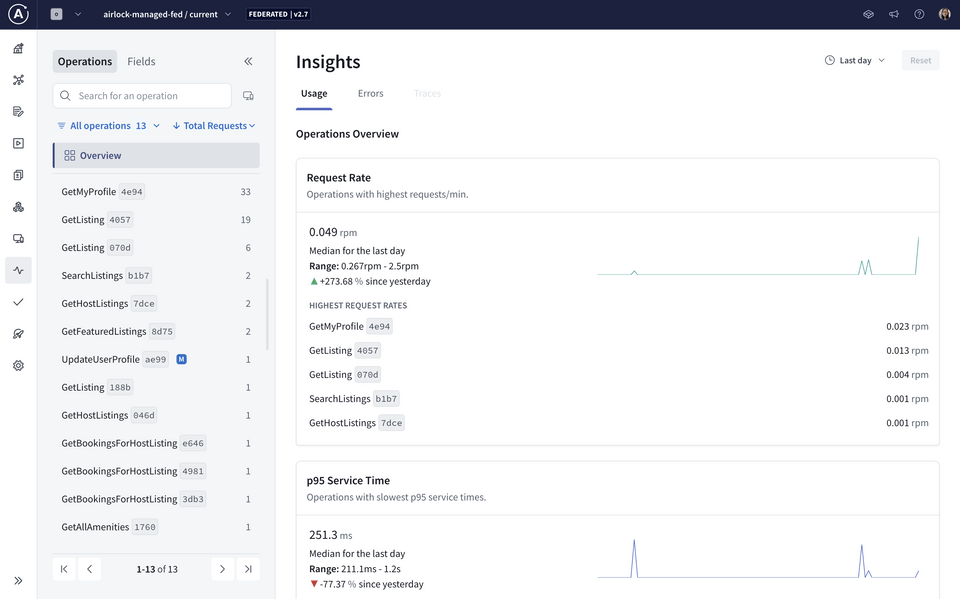
We recommend that clients clearly name each GraphQL operation they send to the graph, because these are the operation names you'll see in your metrics.
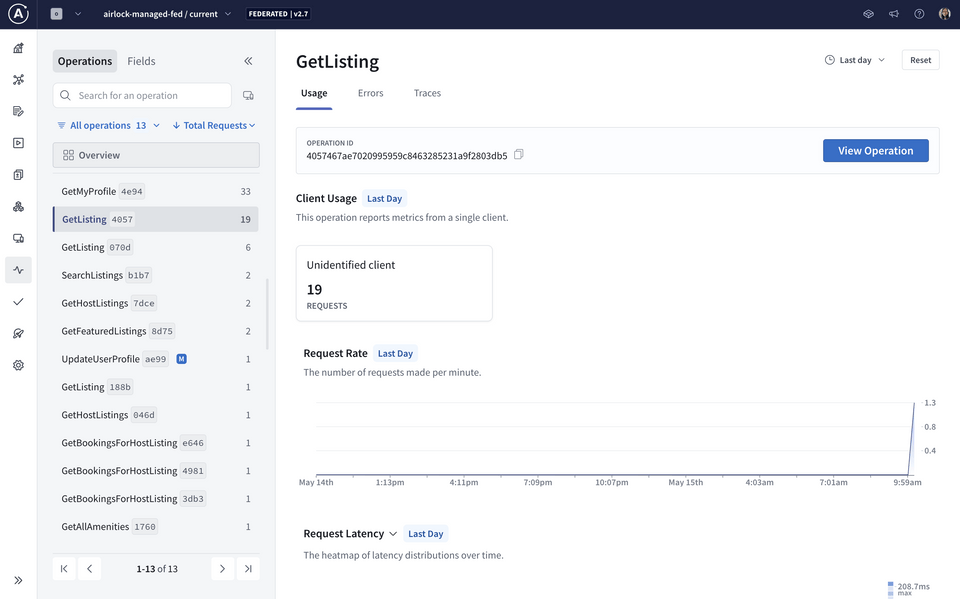
We can also filter to select a particular operation to see more specific details about its usage, as well as its signature, which is the shape of the query. We can see the number of requests that have been made and how long each request takes over time.
It looks like one of Airlock's highest-requested operations is GetListing. We can click on the operation to see more detailed insights.
Field usage
GraphOS also gives us insight into the usage metrics of our graph's fields. We can navigate to this page by clicking the Fields tab inside the Insights page.
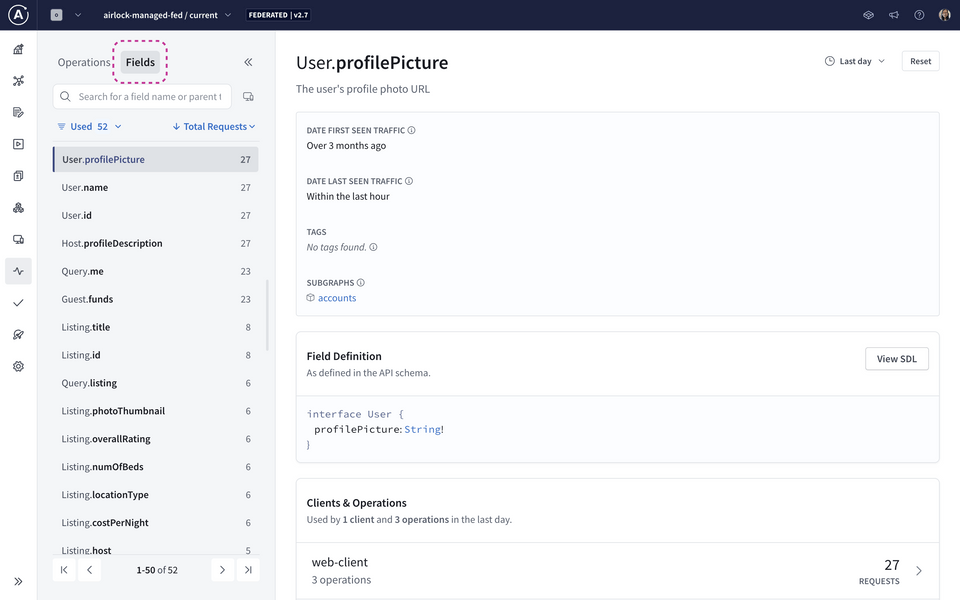
We can use the dropdowns on the top-right side of the page to filter metrics based on a custom time range.
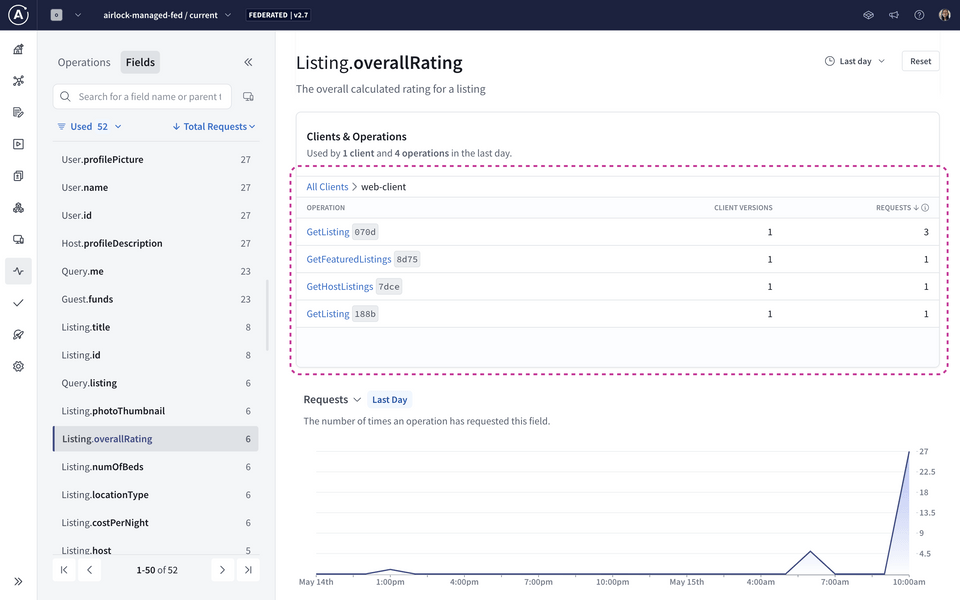
Let's take a closer look at the Listing.overallRating field as an example. In the Usage section, we can see exactly which operations include the Listing.overallRating field:
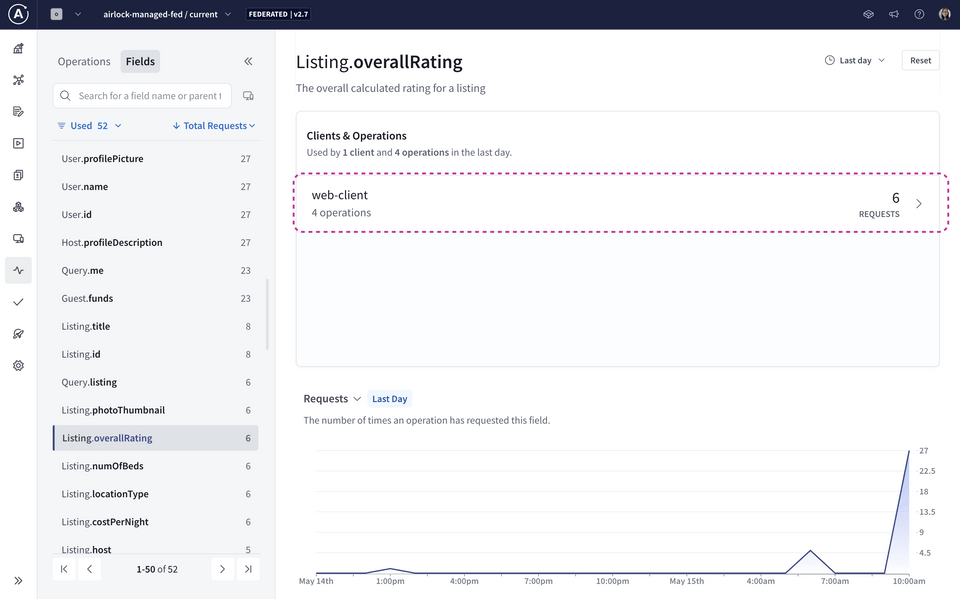
With a larger time period filter, we can see two new columns: requests and executions.
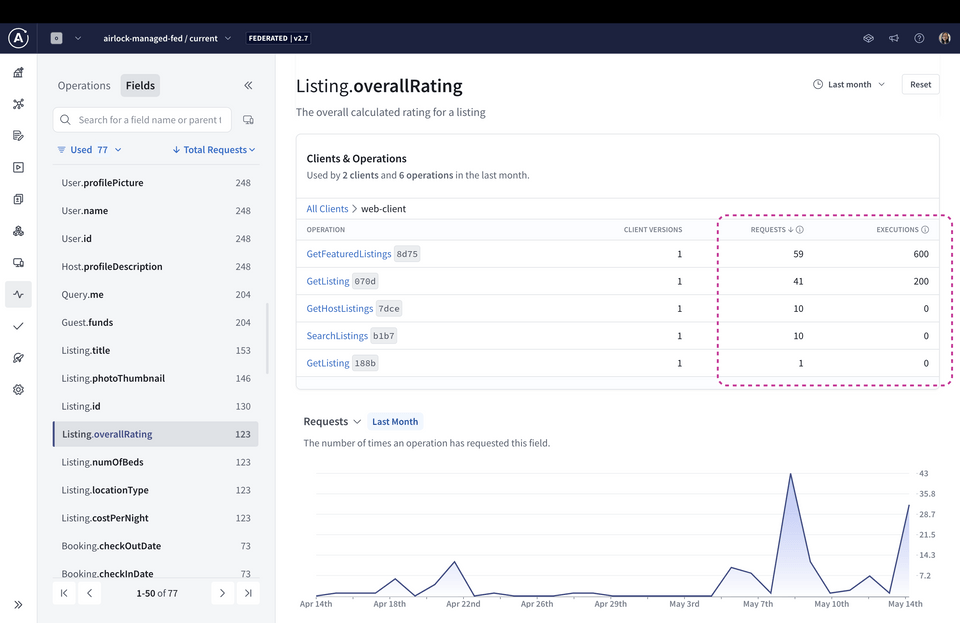
Field usage metrics fall under two categories: field requests and field executions.
- Field requests represent how many operations were sent by clients over a given time period that included the field.
- Field executions represent how many times your servers have executed the resolver for the field over a given time period.
Note: The values for field executions and referencing operations can differ significantly. You can find out the possible reasons by reading the Apollo docs on field usage metrics.
Using insights
We can use these metrics to monitor the health and usage of our graph's types and fields. This helps us answer questions like:
- Are there some fields that don't get any use at all? Are there deprecated fields from long ago that aren't being used but are still in the schema? Maybe it's time to remove these from the graph to keep our schema clean and useful.
- Are we planning on making a significant change to a field? Which clients and operations would be affected? We'll need to make sure they're looped into any changes we make.
As our graph evolves, these are good questions to keep in mind, and GraphOS will always be there to help answer them!
Practice
Key takeaways
- Operation metrics provide an overview of operation request rates, service time, and error percentages within a given time period or for a specific operation.
- Field metrics include field requests (how many operations were sent that included that field) and field executions (how many times the resolver for the field has been executed).
Congratulations 🎉
Well done, you've reached the end! In this course, we learned all about how to work with an existing supergraph in production. We saw how to incorporate schema checks and graph variants into a CI/CD workflow so we can ship new features with confidence. We also explored different types of errors we might encounter from build checks and operation checks. Finally, we looked at how to use GraphOS to discover metrics on our client operations and field usage.
See you in the next series!
Share your questions and comments about this lesson
Your feedback helps us improve! If you're stuck or confused, let us know and we'll help you out. All comments are public and must follow the Apollo Code of Conduct. Note that comments that have been resolved or addressed may be removed.
You'll need a GitHub account to post below. Don't have one? Post in our Odyssey forum instead.