Overview
GraphOS provides us with observability tools to monitor the health and performance of our supergraph. These tools help surface patterns in how our supergraph gets used, which helps us continue to improve it.
In this lesson, we will:
- Explore supergraph insights through the operation and field metrics provided by GraphOS
- Learn how to set up client awareness to indicate which operations were sent by which client
Sending (fake) traffic to the supergraph
We're still in tutorial-land, so there isn't any real production traffic going to our supergraph. Unless you actually went ahead and shared your API with others, in which case, good for you!
Let's go ahead and get some numbers in here so we can walk through what it might look like if we did have more traffic.
The Code Sandbox below contains a script that takes a supergraph URL and sends requests to it over a period of time. We'll use it to send fake traffic to our supergraph.
Go ahead and enter your URL (you can find that at the top of your supergraph's README page). Then press the button to trigger the script!
Note: Right now, our Poetic Plates API does not have any protection against malicious queries or denial-of-service (DoS) attacks. In a future course, we'll cover more techniques to secure your supergraph. In the meantime, you can check out the Apollo technote about the topic to learn more about rate limiting, setting timeouts, pagination and more.
Now we're ready to dive into our supergraph metrics!
Operation metrics
Let's head back to Studio, where our supergraph metrics live. First, let's check out the Insights page.
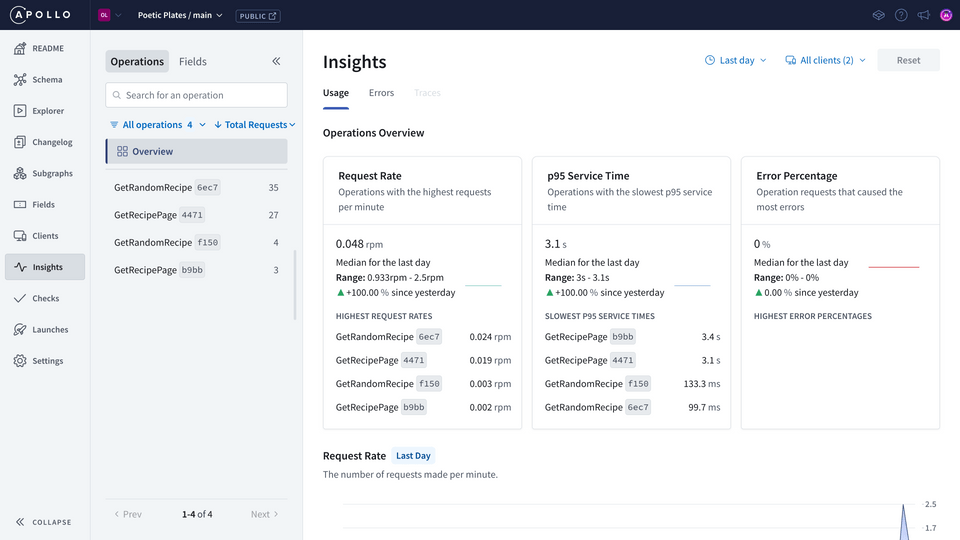
The Operations tab gives us an overview of operation request rates, service time, and error percentages, including specific operations for each of these that might be worth drilling deeper into.
We recommend that clients clearly name each GraphQL operation they send to the supergraph, so we can easily view them in our metrics.
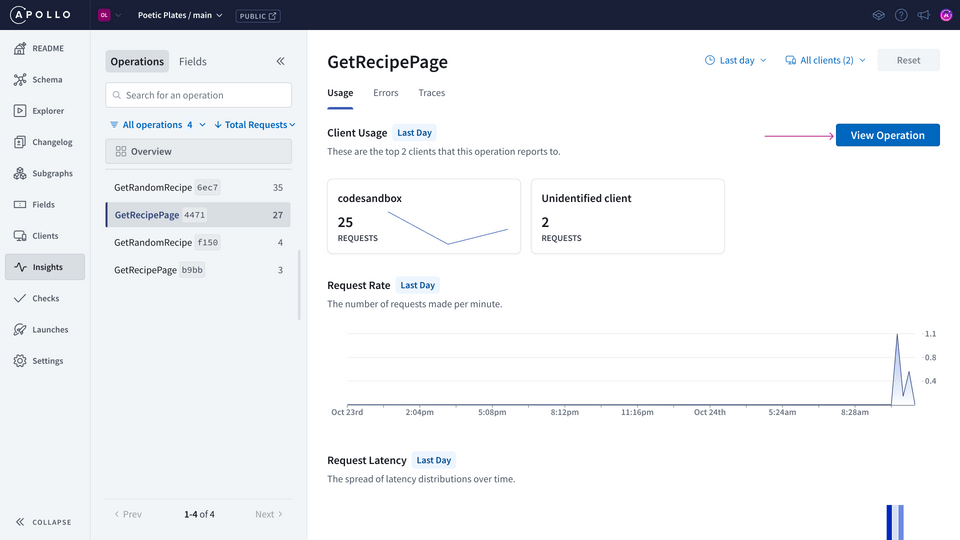
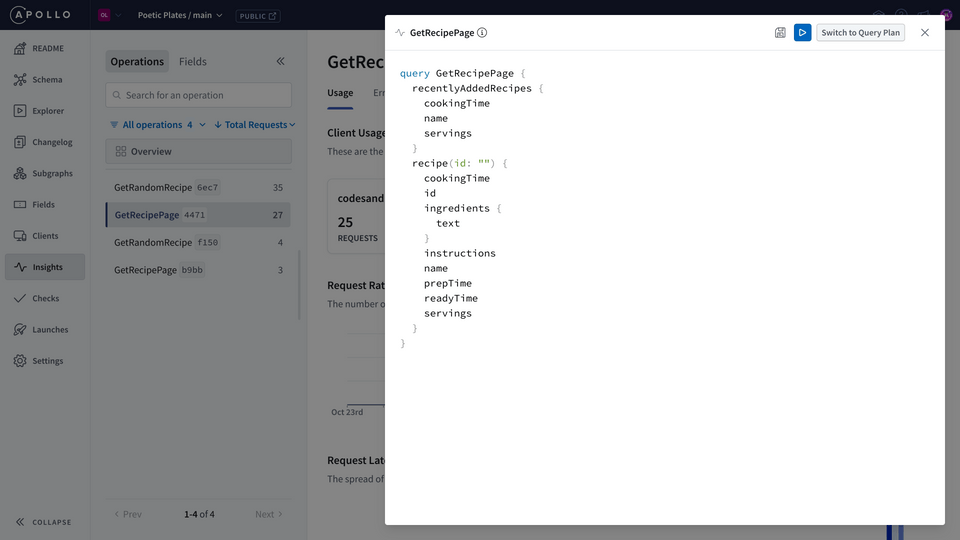
We can also filter to select a particular operation to see more specific details about its usage, as well as its signature, which is the shape of the query. We can see the number of requests that have been made and how long each request takes over time.
Field metrics
Next, let's check out field metrics. Head over to the Fields tab.
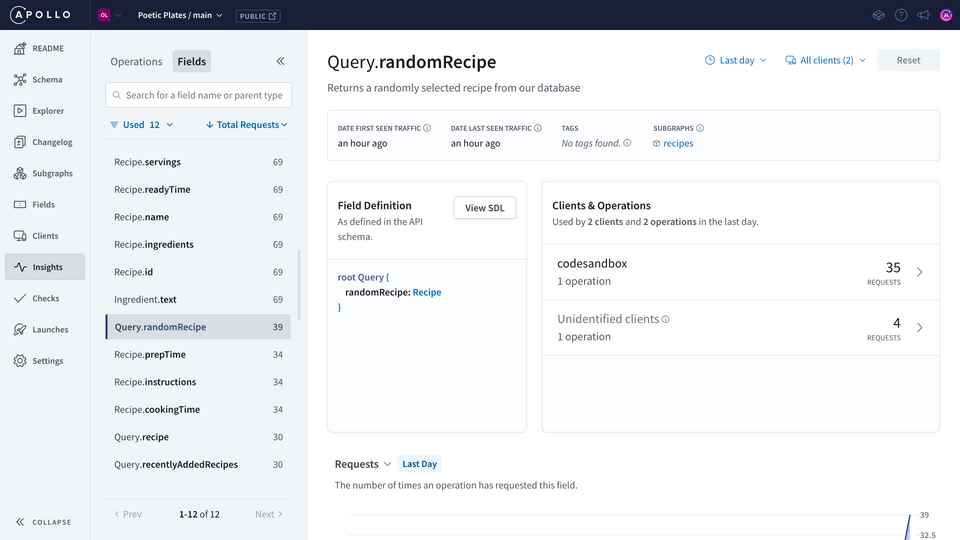
Beside each field, we'll see the total number of requesting operations, which is the number of operations in a given period that have included that particular field.
Note: There's another type of metric called field executions. To see this metric, you'll need a higher volume of requests being sent to your supergraph. You can learn more about the difference between field executions and requesting operations in the Apollo documentation.
And once again we can dive deeper. Click on a field to navigate to a detailed view.
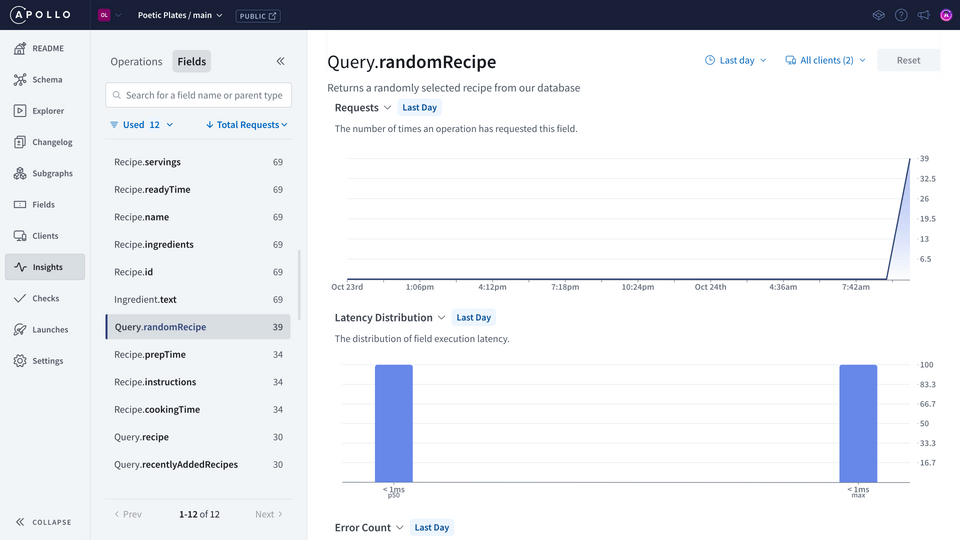
We can use both operation and field metrics to monitor the health and usage of our supergraph's types and fields and determine where we can start to improve, based on how they're performing and how our clients are using them.
Client awareness
Client awareness is another powerful feature of GraphOS. Over on the Clients page we can check out how each of our clients is using our supergraph, such as which operations they're requesting the most, any issues they're running into and which fields they're using. Having access to client-specific metrics is cool because it gives us a heads up on when to deprecate or optimize certain fields.
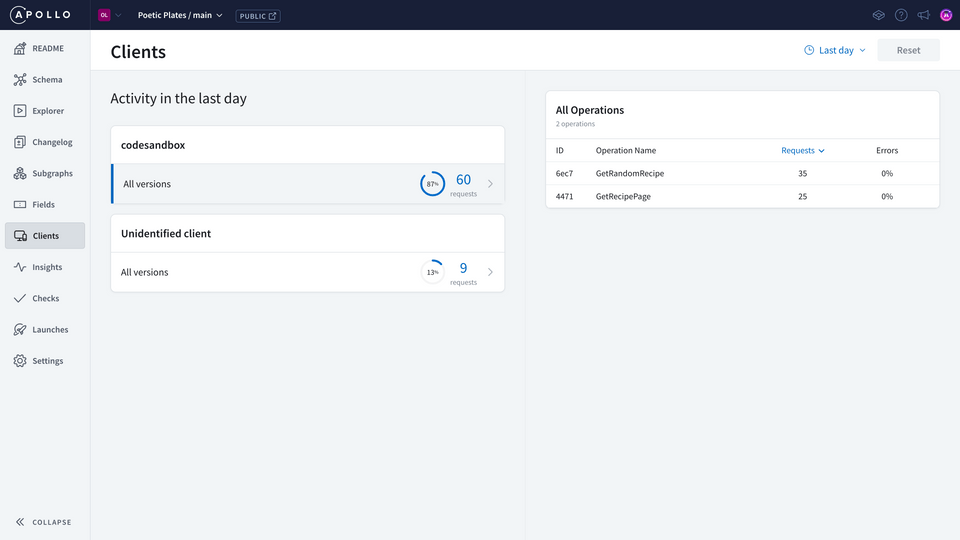
For both operations and field metrics, you can also see client usage information when you dig into a specific operation or field.
To enable client awareness, clients should send two specific HTTP headers in their requests: apollographql-client-name and apollographql-client-version.
Note: Client version metrics are only available on Enterprise plans.
We recommend encouraging all downstream clients to include those client-specific headers with every request. This information will show up on GraphOS so we can see exactly where requests are coming from.
Note: If you're using Apollo Client, you can add the name and version properties when you instantiate the ApolloClient class. You can read the Apollo documentation for a code snippet example.
Practice
Key takeaways
- Operation metrics provide an overview of operation request rates, service time, and error percentages within a given time period or for a specific operation.
- Field metrics include the requesting operations metric, which lists the number of operations in a given period that have included the particular field.
- To set up client-aware metrics in GraphOS, incoming requests should include one of these headers:
apollographql-client-nameandapollographql-client-version.
Up next
We're now equipped with helpful observability tools to give us a peek into our supergraph as more and more clients start using it. Speaking of clients, let's take advantage of a cool feature from our cloud router to improve the client querying experience.
Share your questions and comments about this lesson
Your feedback helps us improve! If you're stuck or confused, let us know and we'll help you out. All comments are public and must follow the Apollo Code of Conduct. Note that comments that have been resolved or addressed may be removed.
You'll need a GitHub account to post below. Don't have one? Post in our Odyssey forum instead.