Overview
Let's plate up our changes and send them out to GraphOS! 🍽️
In this lesson, we will:
- Publish subgraph changes to GraphOS
- Learn about trace metrics and how to analyze them in Studio
- Learn how to turn on subgraph sources
Publishing to GraphOS
Here's how we land our local changes to production:
Run schema checks locally to validate that our changes don't break current functionality.
Merge our subgraph codebase changes to GitHub.
Deploy the runtime code for the subgraph server to Railway (this happens automatically, Railway is listening for changes to our GitHub main branch).
Publish the subgraph schema to GraphOS. This triggers a launch, which when successfully completed, will compose a new supergraph schema for the router to use.
If you've completed GraphOS: Safe API delivery, you'll be familiar with this process, and you might even have CI/CD set up to take care of everything 😎 Go ahead and follow the process! If you need a refresher, head over to Lesson 7: Field insights of the course and refer to the "Deploying our changes" section.
If you haven't completed the course, no worries! If you'd like to learn more about each command we'll be running and how to integrate the process into a CI/CD workflow, that course goes deep into all the details. For now, we'll walk you through it, rapid-fire style, and we'll use manual commands.
First, let's run schema checks. In a new terminal, run the command below. Replace
<GRAPH_REF>below with your own!rover subgraph check <GRAPH_REF> \--schema ./schema.graphql \--name recipesWe should receive a message saying that one new field has been added (the
cookwarefield) and everything is passing. Hooray! We won't be making any breaking changes to our supergraph.Next, let's add and commit our changes.
git checkout -b feature/recipe-cookwaregit add .git commit -m "Add Recipe.cookware to subgraph."Next, we'll push our changes to Github, straight to the
mainbranch.git push -u origin mainThis will trigger a deploy in Railway. Head on over to your application on Railway and monitor its progress. When it's ready, head back to GitHub.
The codebase changes have been deployed, so let's make sure our schema is up to date in GraphOS. We'll run a
rover subgraph publishcommand. Again, replace the<GRAPH_REF> below with your own!rover subgraph publish <GRAPH_REF> \--schema ./schema.graphql \--name recipesThis triggers a launch!
Jump over to Studio in your browser and navigate to the Launches page. We'll wait for the launch to show green checkmarks and the "Deployed" label before moving on to the next section.
https://studio.apollographql.com/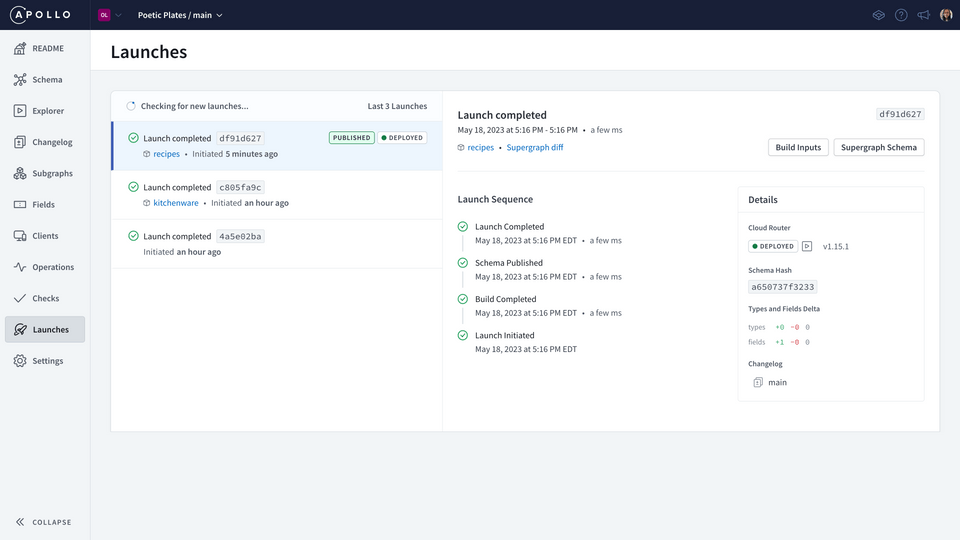
Subgraph changes in Studio
Let's see our changes in action! Head over to Explorer so we can run that dream query of ours again, this time in production.
query GetRecipeAndCookwareInformation {recipe(id: "rec3j49yFpY2uRNM1") {namedescriptioningredients {text}instructionscookware {namedescriptioncleaningInstructions}}}
Nice! We had this all working locally with rover dev before, so we were fairly confident about the change, but now we can validate it 100%!
Let's check out some other cool things while we're here.
In the Documentation panel on the left, click the gear icon to access the Settings.
![]()
Scroll down to the Editor hints section and toggle them on. Select Subgraph source. Now we can see which subgraph each field is coming from, inline with our query.
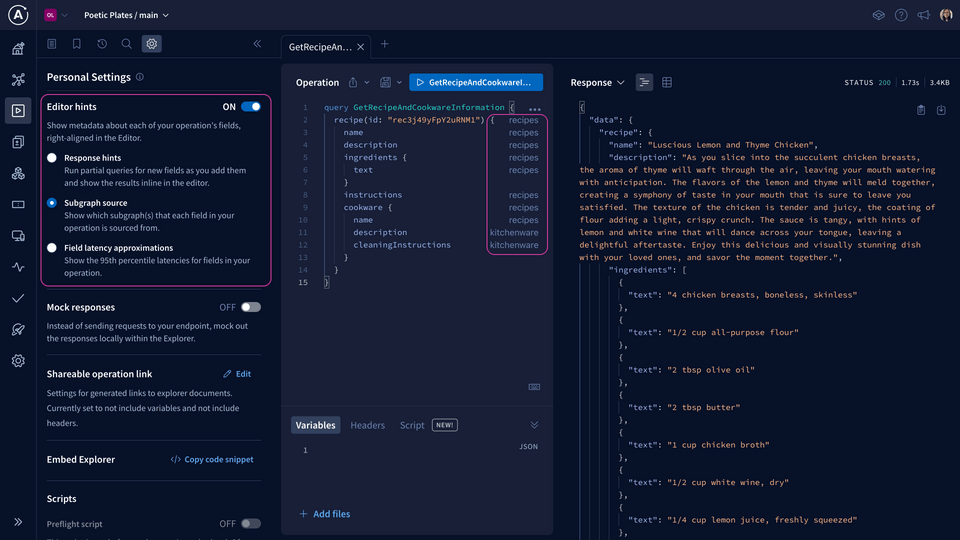
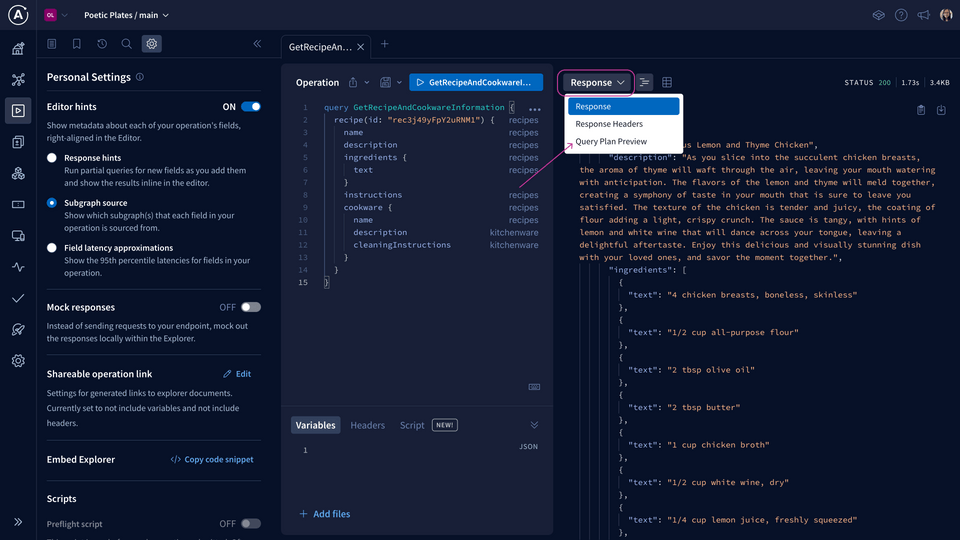
Let's take a peek at the query plan the router created for this specific operation. Click the arrow next to Response and select Query Plan Preview.
We can view this as a chart, or as text if we select the icon to "Show plan as text". We won't worry too much about the query plan syntax– the router knows what's going on! But this is useful when we start to involve more subgraphs and more complex queries that need optimization.
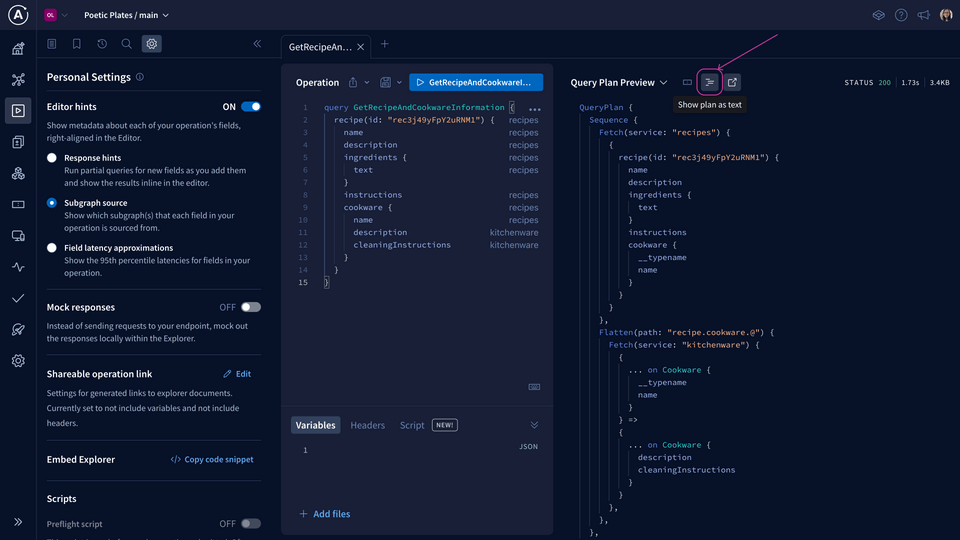
Let's send a few more operations to our supergraph before we move on to investigating trace metrics! Run that dream query a few more times!
Trace metrics
A trace shows the execution of a single GraphQL operation from start to finish. It includes a breakdown of the timing and error information for each field resolved in that operation.
In a supergraph, we have federated traces, which are constructed from timing and error information provided by our subgraphs.
Both our recipes and kitchenware subgraphs use the @apollo/subgraph library, so these federated traces are enabled by default and we don't need to do anything extra!
Note: If you're using a different subgraph library, you can consult this list in the Apollo documentation to determine if it supports federated tracing and how to enable it.
With traces, we can start to see which subgraphs or fields are taking a long time to resolve, which helps us identify where we can make improvements!
To access traces, head to the Operations page in Studio. Select an operation from the dropdown.
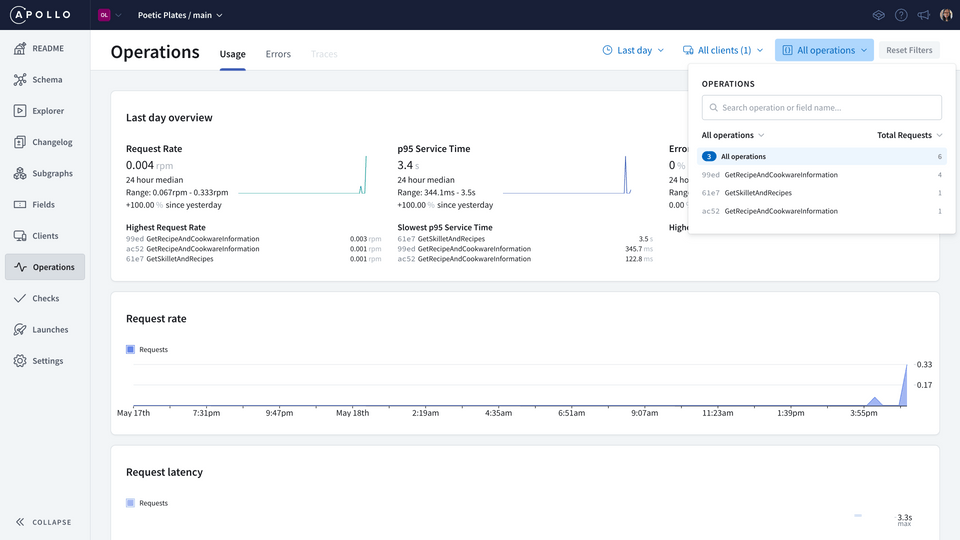
When we select a particular operation, we can see more specific details about this operation's usage, as well as its signature (which is the shape of the query). We can see the request rate (the number of requests that have been made), and the latency of the request (how long each request takes) over time.
Let's take a look at the Traces tab.
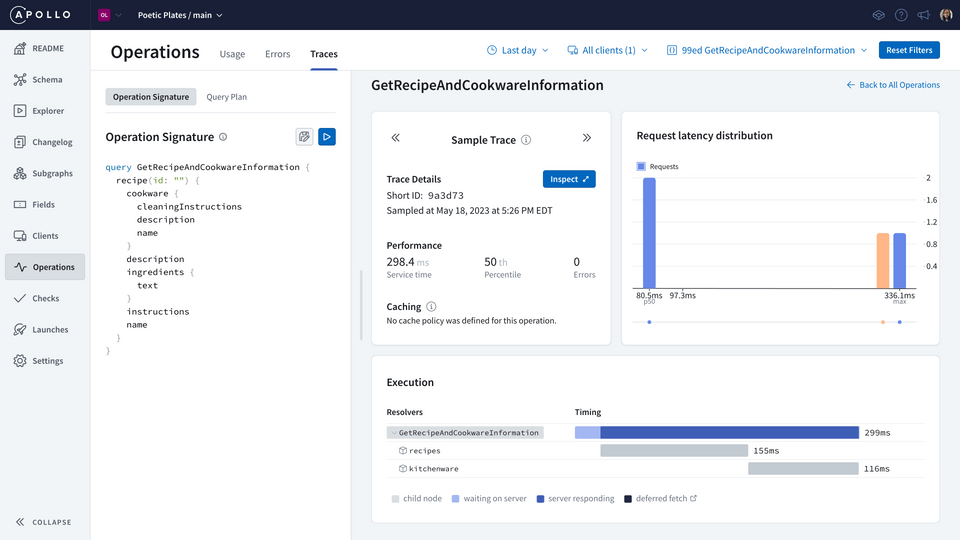
GraphOS saves one sample trace per latency bucket, so we can select a bar from the chart to analyze that particular trace and observe the timing details for that particular operation.
Pretty handy! For each operation, we can dig further into the time it takes for each subgraph to resolve its fields. From there, we can tweak and improve as necessary!
Practice
Key takeaways
- Using
rover devfor local development, in conjunction with schema checks, helps us validate and test changes before pushing them to a supergraph in production. - A federated trace provides a breakdown of timing and error information for each field in a particular operation, as provided by the subgraphs.
Conclusion
You've reached the end, well done!
You've got all the ingredients for success to grow your supergraph to your heart's content. In this course, we learned how to quickly add a subgraph with a few clicks of a button in Studio. We got our hands dirty with local development and used rover dev to run a router locally: a playground to explore and dream up new features. We dipped our toes into the world of federation, learning what entities are and how to use them to connect data between subgraphs. Lastly, we shipped our changes to production, bringing the improved version of Poetic Plates to the world – now with kitchenware! 🍳
What's next? We're cooking up more things to help you on your GraphOS journey.
In the meantime, why not dive into the Apollo Federation with our Voyage series? You can start with Voyage I: Federation from Day One.
See you in the next one!
Share your questions and comments about this lesson
Your feedback helps us improve! If you're stuck or confused, let us know and we'll help you out. All comments are public and must follow the Apollo Code of Conduct. Note that comments that have been resolved or addressed may be removed.
You'll need a GitHub account to post below. Don't have one? Post in our Odyssey forum instead.