Sending fake traffic
We've just launched our supergraph, so it hasn't received much traffic at all yet. Let's go ahead and get some numbers in here so we can walk through what it might look like if we did have more traffic.
The Code Sandbox below contains a script that takes a supergraph URL and sends requests to it over a period of time. We'll use it to send fake traffic to our supergraph.
Go ahead and enter your URL (you can find that at the top of your supergraph's README page). Then press the button to trigger the script!
Note: Right now, our Poetic Plates API does not have any protection against malicious queries or denial-of-service (DoS) attacks. In a future course, we'll cover more techniques to secure your supergraph. In the meantime, you can check out the Apollo technote about the topic to learn more about rate limiting, setting timeouts, pagination and more.
GraphOS Metrics
Let's head back to Studio, where our supergraph metrics live. Here, we'll see the kinds of insights Studio assembles for our supergraph based on usage, latency, and errors. We'll start with the Operations page.
Operation metrics
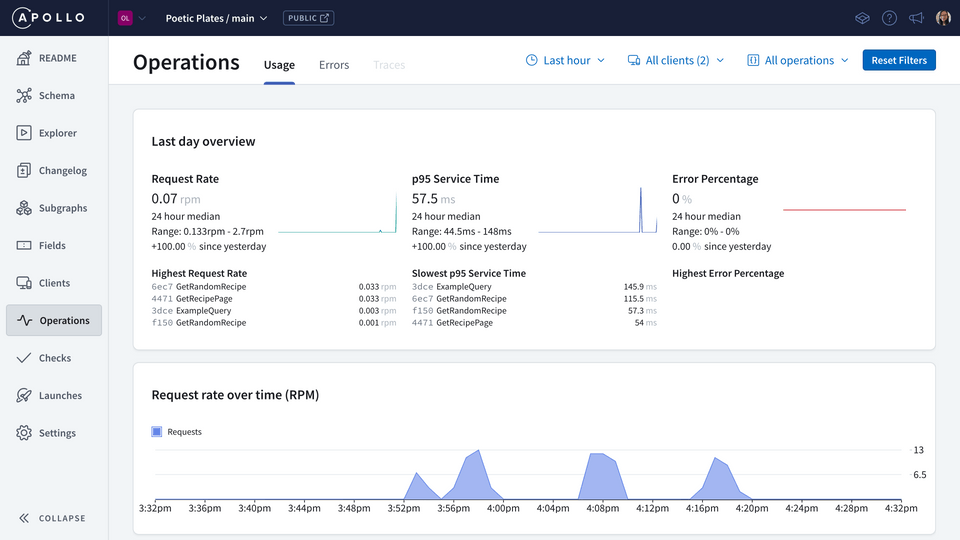
The Operations page focuses on just that—operations that have been sent to our supergraph! We've just faked a bunch of operations through the Code Sandbox, so we should be seeing some data here.

We'll find an overview of operation request rates, service time, and error percentages, including specific operations for each of these that might be worth drilling deeper into.
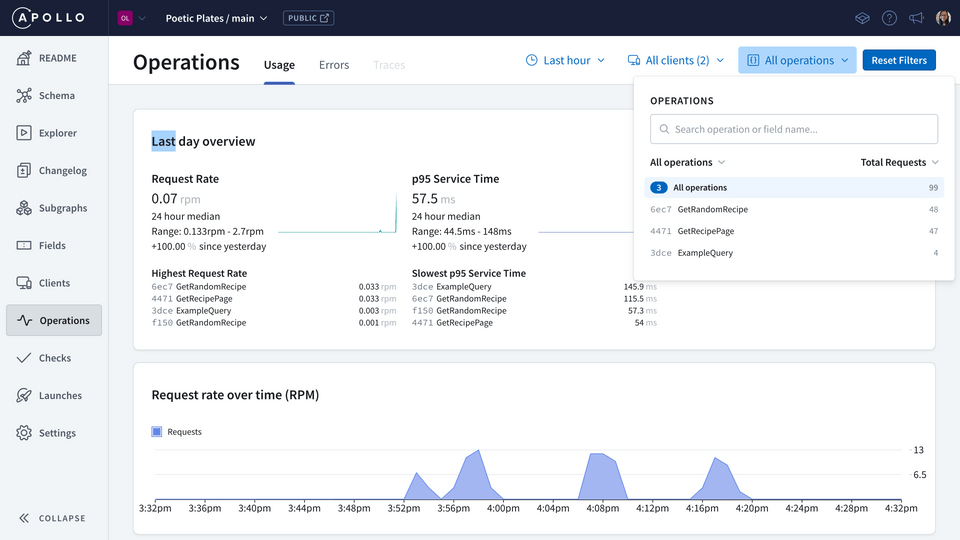
This page also comes with some helpful filters which let us customize the specific time period, clients, and operations we want to see data for. By default, we'll see metrics for operations executed in the last day.


Note: We recommend that clients clearly name each GraphQL operation they send to the supergraph, so we can easily view them in our metrics.
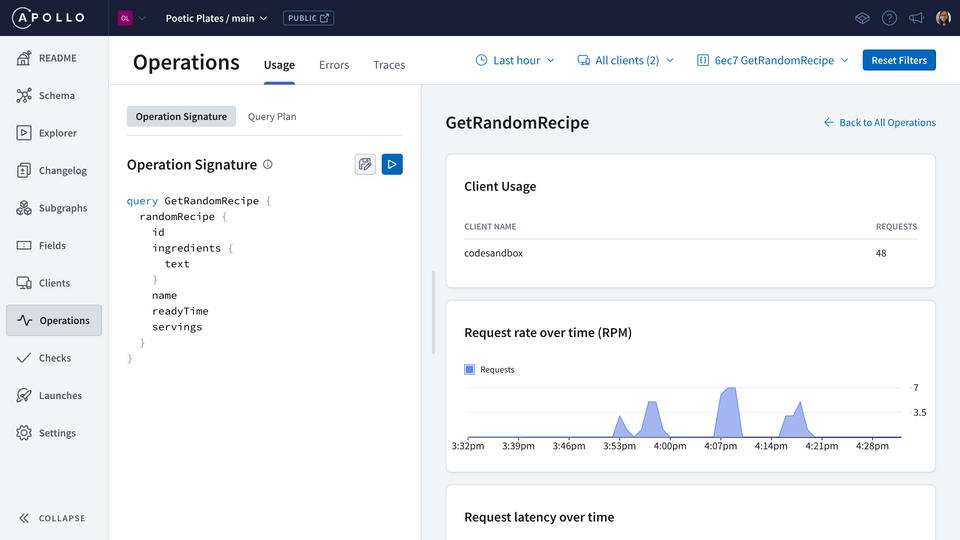
By clicking into an individual operation, we can see more specific metrics along with the operation signature, which shows us the particular fields that were involved in the operation. With that knowledge, we can jump over into the Fields tab to dig deeper.
Field metrics
The Fields page lists all of the fields in our schema, sectioned by the type they appear on. Here we can investigate the fields in our operation, reviewing which clients have requested them and how often.
When our graph starts to receive more traffic, we can get resolver-level metrics—which let us drill a lot deeper to see what's going on with each field and where there might be a higher level of latency.
With a GraphOS enterprise plan, we can set the sampling rate to be higher; this lets us see field-level insights with less traffic.
Slow queries
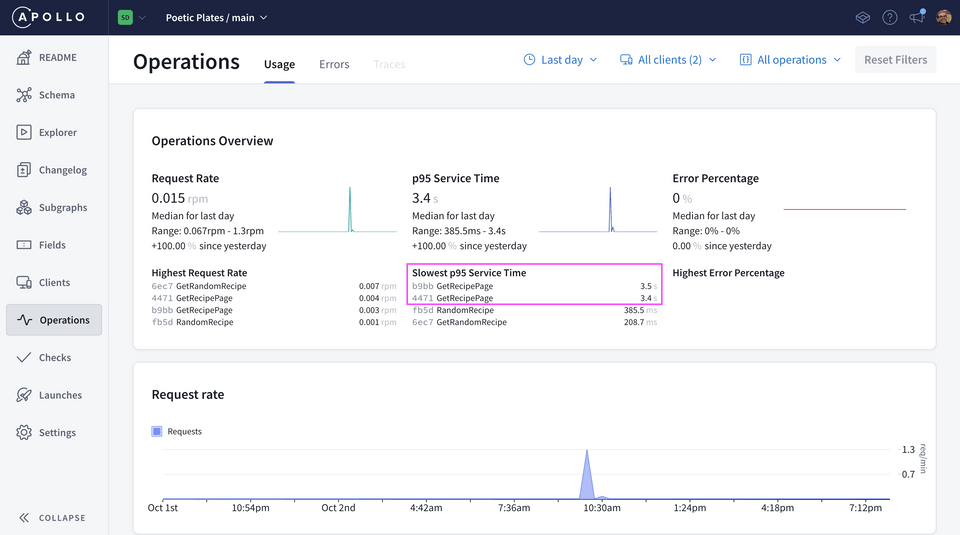
When we analyze our graph's metrics, we can compare which queries are taking the longest to resolve. The Operations page includes a section called Slowest p95 Service Time; here we'll see the names of the operations, along with the time—either in seconds, or milliseconds, typically—it took for them to resolve.

Note: The "p95" indicates that the time given for each operation is something of an upper limit. 95% of the operation's executions actually complete faster than the reported value, but this way we can more easily see the worst time an operation takes to resolve.
The query GetRecipePage stands out here as the slowest operation—with a whopping three seconds to resolve! Let's look at how we tackle queries with parts that resolve more slowly than others in the next section.
Share your questions and comments about this lesson
Your feedback helps us improve! If you're stuck or confused, let us know and we'll help you out. All comments are public and must follow the Apollo Code of Conduct. Note that comments that have been resolved or addressed may be removed.
You'll need a GitHub account to post below. Don't have one? Post in our Odyssey forum instead.