How we know a router performance result is real

Dan Anderson Hall
In part one we introduced the Runtime Testing Framework (RTF), which we use to deploy, test and measure services in production-like environments.
Every time we release a new version of the GraphOS Router, one of the questions we ask: “is it slower?” It’s harder to answer than it sounds. Two identical test runs never give exactly the same result, so a real performance degradation and ordinary noise can look the same. To separate them, we built a series of performance ‘gates’, or checks every result has to pass before we trust it. This is the story of how we used them to validate v2.18.0, and what they taught us.
What a trustworthy performance test needs
A performance test result only means something if identical re-runs agree closely enough to tell a real change from noise. We start with one principle: the tools doing the measuring never share resources with the thing being measured. Each run (one test of one version against one graph and router configuration) is deployed into its own Kubernetes namespace (see part one), warms up, then holds a steady load while we measure. It gets a fresh environment containing:
- A load generator (k6), on its own node so it never competes with what it’s measuring
- The router under test
- A subgraph mock that generates valid data for each query from the real schema, with a fixed, artificial latency. Its random generation is seeded, and it caches each response by query, so the same query always gets the same answer. Seeding alone cut run-to-run variation in client latency from 244% to about 11%.
- A mock Studio service, so no test data reaches Studio.
- A load balancer in front of several mock replicas, so the mocks never become the bottleneck.
Everything else runs together on one dedicated node, with k6 on a second node, so network hops between components do not add noise. We repeat every run five times to have a measure of run-to-run noise to judge changes against.
We judge a release on six metrics:
- Router latency distribution, measured inside the router, as well as
- Router p99, as a single number and the figure most people already observe
- Client latency distribution, measured at k6
- Router memory, using jemalloc allocator metrics, averaged over the measurement window
- HTTP error rate, or the share of responses with a 4xx or 5xx status
- GraphQL error rate, or responses that succeeded at the HTTP level but carried GraphQL errors in the body
A latency distribution is a histogram of every request’s response time, so we can read off any percentile we like. Because it uses every request, not one number per run, we can detect changes of about 2–3%, against about 6.5% for a single p99 figure.

If we look at p99 alone, nothing has changed. The distribution, on the other hand, shows the faster half of requests got slower. The shift was within the 10% zone, so it wasn’t a regression, but a p99-only view would never have shown it.
So now we have a set of metrics to measure, we need to make sure that when we measure them, we have a set of verification checks to ensure any changes are meaningful, which leads us to the idea of ‘gates’.
Gates: framework for validating test runs
A test with too few repeats, or too much noise, can’t see a real slowdown, so it comes back green. A healthy router also comes back green. From the outside they look the same. So we cannot trust a result until it passes what we call a gate: a rule for whether a result is good enough to act on.
We use three gates in sequence, which validate one metric at a time. A run that fails Gate 1 is discarded. A metric whose repeats fail Gate 2 is never compared in Gate 3. That way one noisy measurement costs us that measurement, not the whole test.
| Gate | Question | What it protects against |
|---|---|---|
| Gate 1 | Is this run valid? | Measuring a broken or overloaded test, not the router |
| Gate 2 | Do repeats agree? | Mistaking run-to-run noise for a real change |
| Gate 3 | Has the new version changed? | Claiming a change, or no change that the data can’t support |
Let’s now take the idea of these gates and see how they apply to validating v2.18.0.
Validating v2.18.0
For v2.18.0 we compared the baseline, v2.17.0, against the candidate, the v2.18.0 release candidate. We tested 10 graphs (of varying complexity), each under 5 router configurations, with 5 repeats of everything. That’s 500 runs in all. Let’s explore what happened at each gate.
Gate 1: is this run valid?
Gate 1 decides whether a run measured the router or whether we measured a property of our test environment. A run counts only if the load generator delivered within 2% of its target rate, the run settled into a steady state we could measure, and nothing was still drifting or being throttled while we measured it.
A metric is drifting if it’s confidently still changing by more than 2% every 4 minutes. A run is throttled if the router’s CPU was throttled more than 5% of the time.
Runs fail these checks when the environment, not the router, was the limit, e.g. too little CPU for the complexity of the graph running in the router, or a router that hadn’t settled into a steady state before we started measuring. The memory chart below shows such an example.
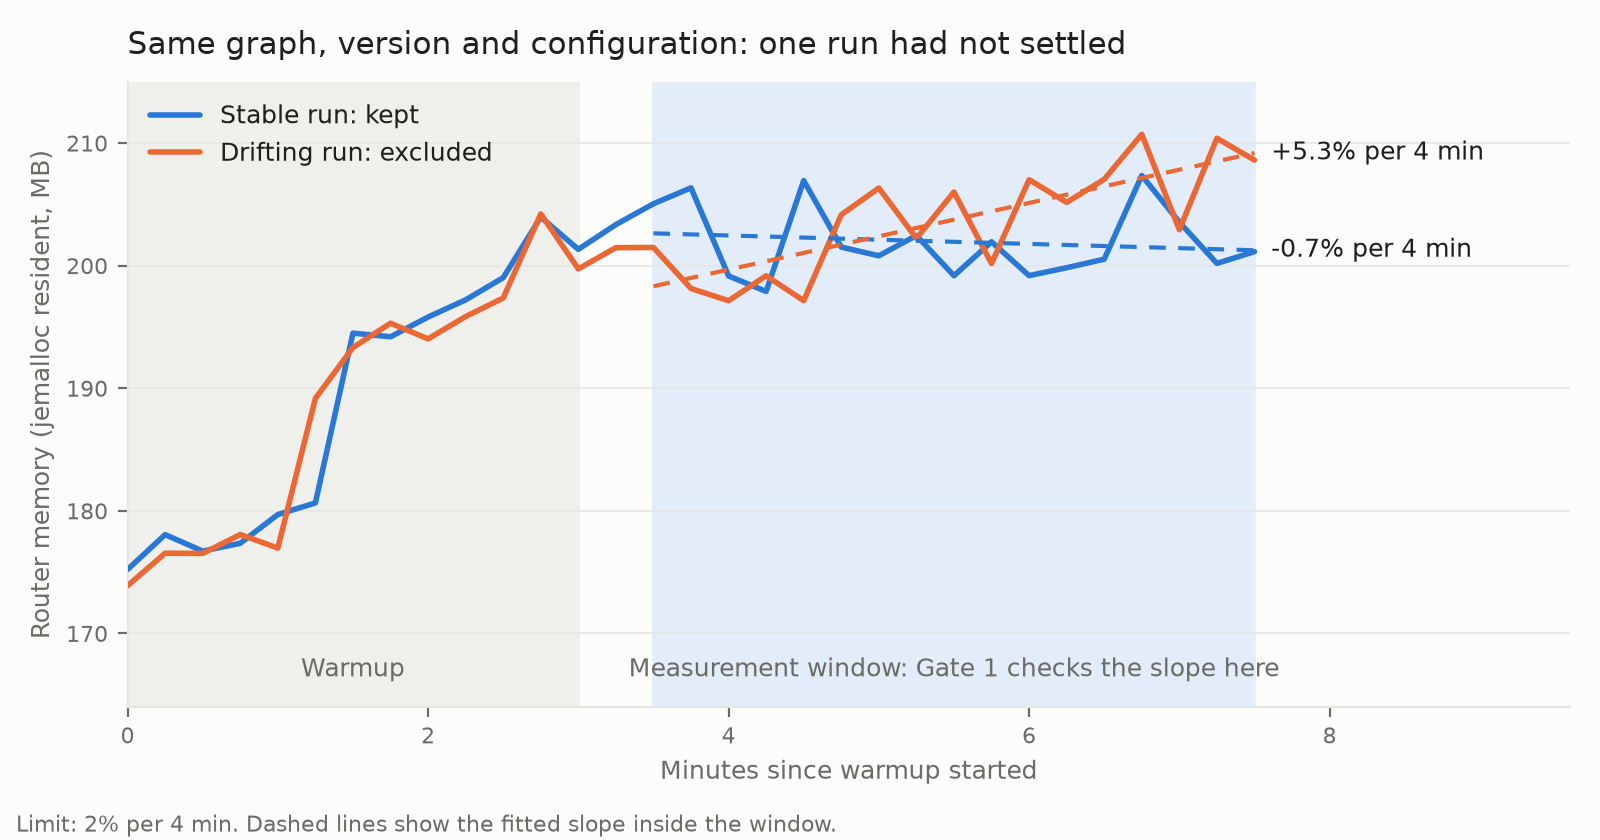
Of the 500 runs, 404 passed this gate. Another 51 were kept but lost a single metric, usually CPU throttling, so that one metric is left out of the comparison for that run while everything else still counts. The remaining 45 were set aside.
Almost all of them came from one graph. 41 of its 50 runs never reached their target rate on either version. It wasn’t a router regression, but a graph that requires more resources than we’d given it in the test environment. Every graph in v2.18.0 got the same CPU allowance, and later validations size it per graph.
The other 4 were excluded because the router’s memory was still climbing while we measured. A 3-minute warmup wasn’t always enough for memory to settle, so in later validations warmup is run for longer.
So now that we’ve removed 45 of the runs, we can take the remaining 455 and pass them through the second gate to see if we’re seeing a consistent pattern.
Gate 2: do the repeats agree?
If five identical runs disagree, any difference between versions is meaningless, and the disagreement is about our harness, not the router behaviour. Gate 2 checks agreement before any comparison is made.
To assess whether runs agree, we compare the latency distributions and single numbers for each run with identical configuration to see how statistically similar they are. For latency distributions specifically, the test is the Wasserstein distance: roughly, how much you’d have to move one histogram to turn it into another. We compare the typical distance between repeats with how different two halves of the same run look from each other. If repeats are much further apart than a run is from itself, they don’t agree. Each run can look valid on its own and still disagree with its repeats.The comparison highlights these disagreements which would otherwise be overlooked.
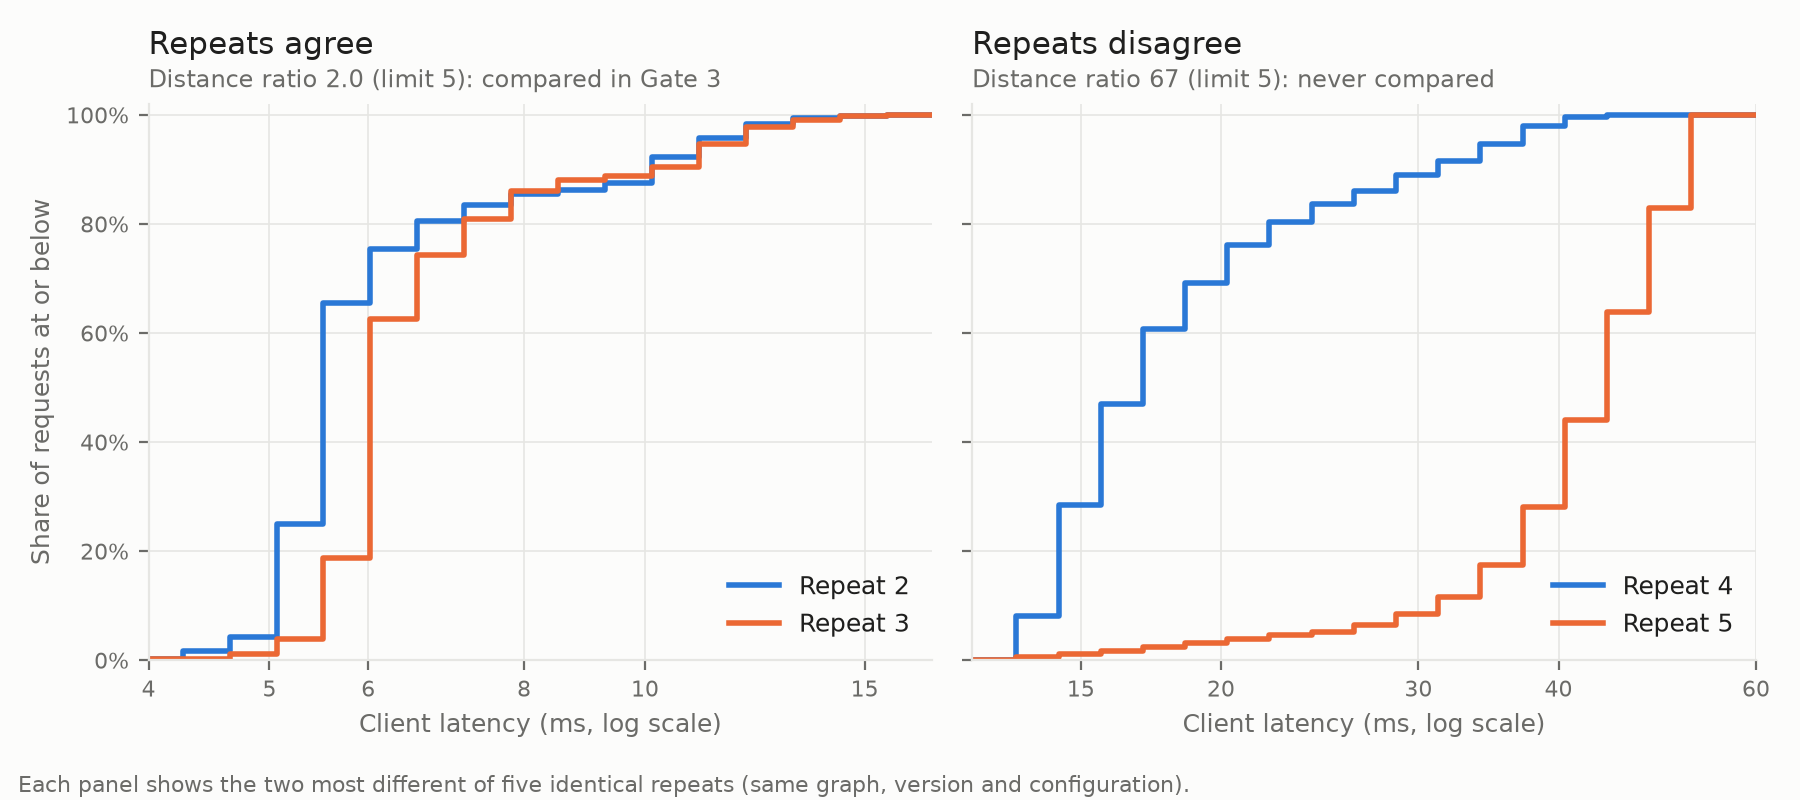
Single numbers,such as router p99 and memory, and error rates get equivalent checks on how much they vary. For most metrics, the coefficient of variation (how much a value varies relative to its average) must be below 15%.
Five repeats was a trade-off between cost and certainty. Some of these checks need more repeats than that, so most single-number metrics, such as router p99 and memory, couldn’t be judged. p99 is especially hard: it’s set by the slowest 1% of requests, a handful of outliers per run, so it jumps around between repeats far more than the median does. That’s why we don’t rely on it alone, and why later validations use more repeats.
Gates 1 and 2 have given us now a set of metrics that we know are:
- Actually testing the router and not a quirk of the environment
- Don’t vary wildly across repeats
Now we can move on to Gate 3 which answers the most important question, did the new version of the router meaningfully change any performance characteristics?
Gate 3: did v2.18.0 change?
There is always some variability between two runs. Tiny shifts can come from things unrelated to the code we ship, such as momentary noise on a node. To account for this, we set a minimum size of change that counts as meaningful: the zone. It’s ±10% at each percentile of the latency distribution and ±5% for single numbers. Gate 3 then asks whether we can rule out a change bigger than the zone.
Gate 3 can return four verdicts for each of the latency distributions and numbers we are analysing:
- Equivalent, where the whole interval is inside the zone
- Regression, where the whole interval is beyond the zone and slower
- Improvement, where the whole interval is beyond the zone and faster
- Inconclusive, where the interval crosses an edge of the zone
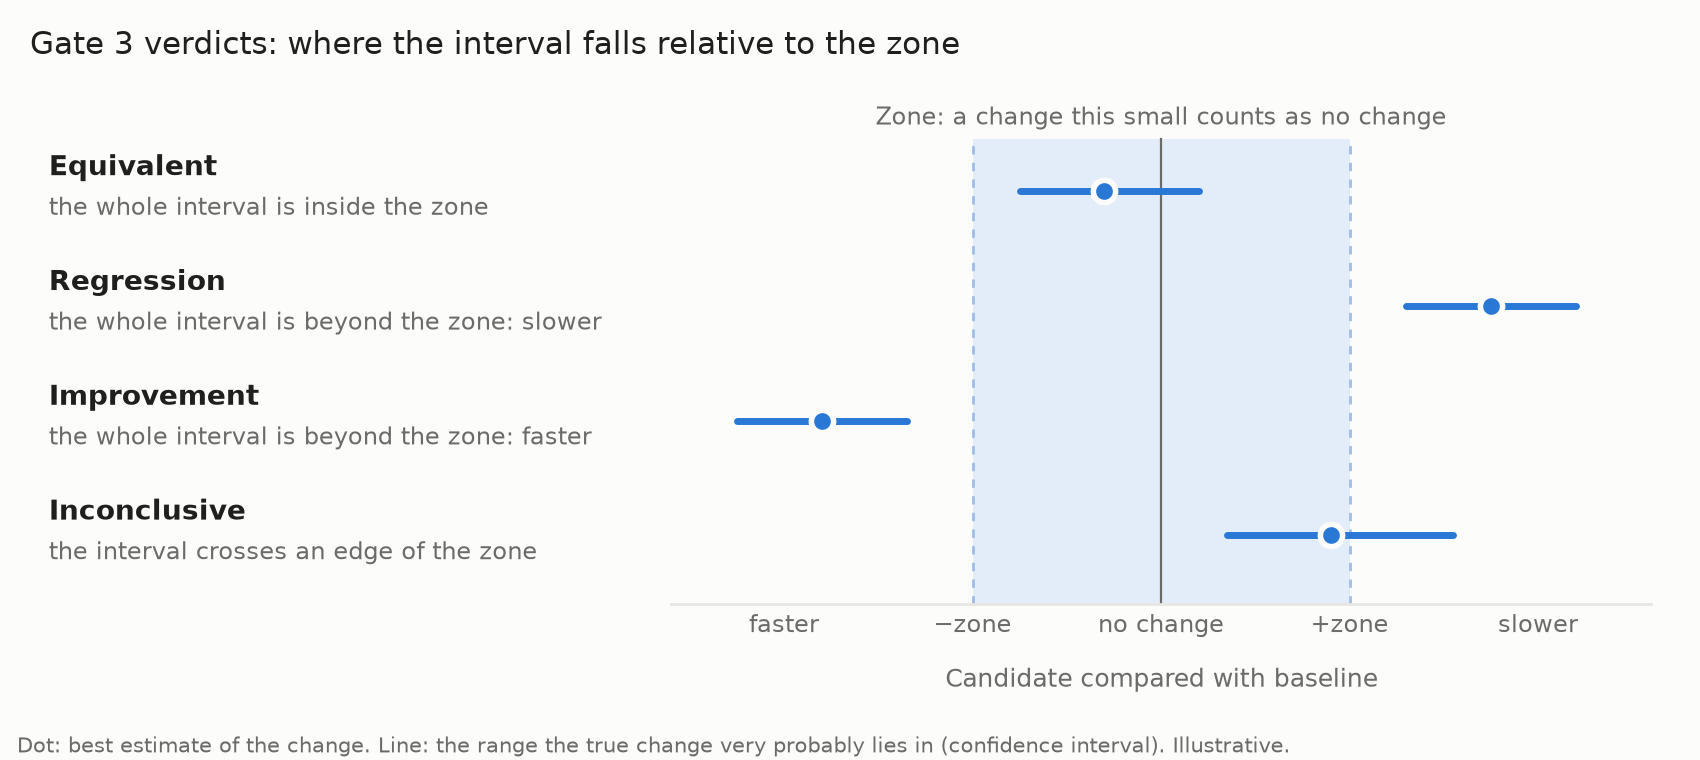
For example, on one graph the candidate’s client p99 was 0.02 ms slower than the baseline. More usefully, we could say with confidence that the true difference was between −0.46 and +0.52 ms, well inside a zone of ±1.30 ms. That comparison is equivalent: a positive statement, not an absence of evidence.
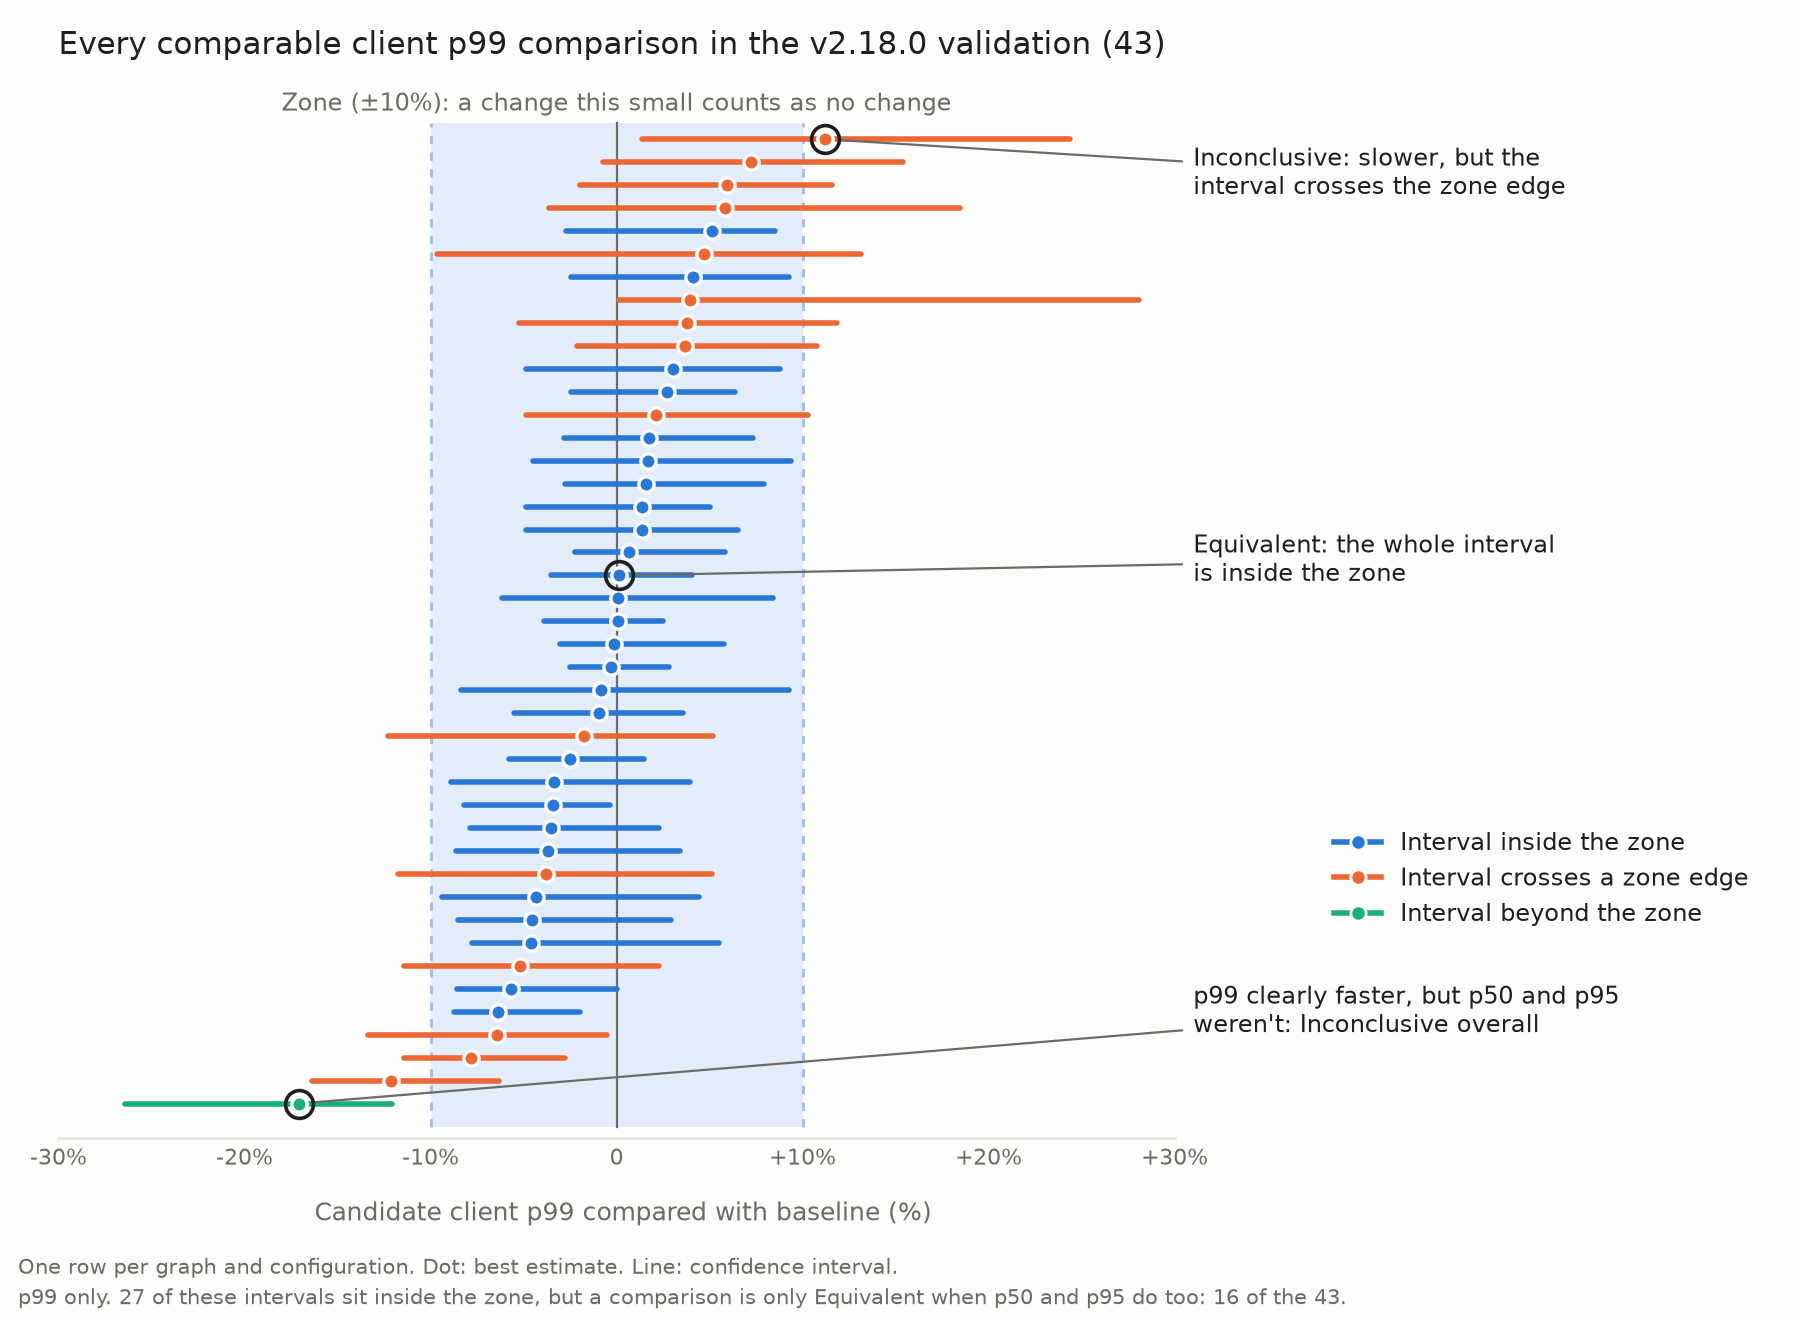
Looking at the client latency metric across 50 comparisons (10 graphs, 5 configurations each), Gate 3 found:
- No regressions and no improvements
- 16 equivalent
- 27 inconclusive
- 7 not comparable, because Gate 1 or Gate 2 had already ruled them out
The other five metrics went through the same process, with none showing a regression.
The large number of inconclusive results may seem to invalidate our conclusions, but this is the reality of benchmarking. On another graph, client p99 was somewhere between 0.15 and 2.60 ms slower. That’s definitely slower, but the interval crosses the edge of a ±1.07 ms zone, so we can’t say whether the change is bigger than the zone. A plain significance test would have called that a regression; we record it as unknown. An inconclusive result doesn’t block a release on its own, but it tells us exactly where we have no evidence either way.
The clearest result came from looking across graphs rather than at each one. Individual graphs are noisy, but if the candidate were slower across the board, pooling them would show it. Pooled over every graph, the candidate’s median and p95 client latency were within 2% of the baseline. A negative control confirmed the harness wasn’t favouring either side. Subgraph latency, which the router version can’t affect, moved by less than half a percent.
Shipping it
The results of the test were validated using sequenced gates, where Gate 1 kept the runs that measured the router, Gate 2 kept the metrics whose repeats agreed, and Gate 3 found nothing in those that got worse.
After all that, what could we say about v2.18.0? There are no regressions across all the metrics we tested. Across graphs, typical client latency is within 2% of v2.17.0. We also know exactly what we didn’t know: we didn’t have enough data to be certain about how most single-number metrics varied, and the same for more than half of the client latency comparisons. That is enough to release. For a release that adds features, “no measurable change” is exactly the result we want.
We’ve since tightened the gates with finer histogram buckets, stricter zones and longer client traffic warmups. Re-analysing the v2.18.0 results through the updated gates leads to the same conclusion: no regressions.
What we learned
Standing back from the above process, we not only discovered the lack of regressions in v2.18.0, but also found ways to meaningfully improve our testing harness as well. Gate 1 found a graph we’d sized beyond what its environment could deliver as well as runs that needed a longer warmup. Gate 2 found repeats that looked valid on their own, but disagreed with each other. Neither of those was a router problem, but without the gates both would have turned into router verdicts.
That’s the real value of the gates: the results we present are about the router, not our testing environment. Building out this system has also allowed us to stop treating “no difference” as automatic good news. We can also say when the answer is “we don’t know enough”.
Finally this process has shown us that our test harness and processes are as important as the router itself and should evolve alongside it. The gates are never ‘finished’ and each validation of a new version teaches us something new about how to further refine our testing story. Every new version we validate shrinks the gap on what we don’t know, and encoding that knowledge in this process means it acts like a ratchet, so what we learn from each validation carries into the next.
Conclusions & what’s next?
Now that we have this system in place, there are three features that we want to deliver to ensure we are both detecting the most regressions possible, while also making these processes as available as possible:
- Historical comparison across releases – Each validation compares two versions, so a change that’s too small to see in any single release can build up across several. Storing results from past runs will let us catch that slow drift.
- Reducing Noise – Every source of run-to-run variation we remove shrinks the inconclusive set, and more repeats per comparison would let every Gate 2 check run. We’re currently looking into more dedicated infrastructure for performance testing and designing mechanisms to ensure workload isolation to enable this.
- Publishing further guidance – We’re currently in the process of extending our testing from regression to answer the question of where performance starts to degrade when the router is under load. We’re hopeful that this can be turned into generalised advice to allow customers to more easily tune their routers in their specific context.
We began trying to answer a (seemingly) simple question of a new router release of “is it slower”? And throughout this blog post we’ve built up a set of machinery to answer that question honestly, including when the answer is “not yet”.
Due to the nature of performance testing we can never say “job done” but what we’ve built here is a way to give more clarity and certainty than ever before on router performance. The GraphOS Router is at the heart of some of our customers’ most critical experiences, and now it has a testing methodology to match.
In the meantime, take a look at the Runtime Testing Framework here. We have an example test plan which illustrates how we set the router performance tests up using RTF. This will run locally using docker compose so should not be treated as a reliable performance test.


